In 1939, the federal government implemented the Food Stamp Program, which in 2008 changed its name to the Supplemental Nutrition Assistance Program (SNAP). This program, designed to provide food assistance to those who need it most, benefited 41.9 million Americans in fiscal year 2022, representing 12.5% of the population, according to data from the Pew Research Center.
Eligibility for SNAP benefits is generally based on a gross income of 130% or less of the federal poverty line, with specific limits for net income. In 2023, these limits equate to $3,007 in gross monthly income and $2,313 in net monthly income for a family of four, although the limits are higher in Alaska and Hawaii. In addition, different limits apply for households with members over age 60 or with disabilities.
Average monthly benefits in April 2023 were $181.72 per person or $343 per household, although these values vary significantly by state. For example, average beneficiaries in New York received $212.09 per month, while in Oklahoma the figure was $127.32, reflecting differences in income and household size.
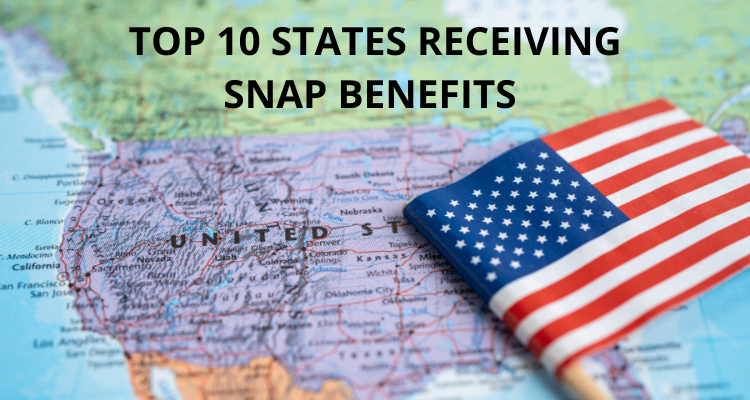
GOBankingRates recently used data from the U.S. Department of Agriculture and the U.S. Census Bureau to identify the 10 states with the highest percentage of households in SNAP, revealing participation rates higher than the national 12.5%. West Virginia tops the list with a rate of 22.04%, followed closely by New York (22.10%), Oklahoma (22.24%), and Illinois (22.62%).
These high rates are attributed to factors such as poverty in West Virginia, economic diversity and unequal wealth distribution in New York, low state income and child poverty in Oklahoma, and SNAP enrollment efficiency in Illinois. This analysis provides a detailed look at state disparities in SNAP participation:
1. West Virginia
- SNAP Participation Rate: 22.04%.
West Virginia is ranked as one of the most economically disadvantaged states in the United States, exceeding the national average. One in five children are living below the poverty line, so the need for food assistance is evident in this state.
2. New York
- SNAP Participation Rate: 22.10%.
Despite being a city that abounds in diversity and wealth, New York faces substantial economic challenges. Beyond the glittering penthouses of Manhattan's Fifth Avenue, many New Yorkers struggle with poverty, with 12.2% of adults and 18.5% of children living below the poverty line.
3. Oklahoma
- SNAP Participation Rate: 22.24%.
In Oklahoma, more than 21% of children live below the poverty line, and state incomes are near the lowest levels among the 50 states. This combination of factors contributes significantly to maintaining a considerably high SNAP participation rate in the state.
4. Illinois
- SNAP Participation Rate: 22.62%
Although the median income in Illinois ranks 17th highest in the country, 10% of adults and 16% of children still live below the poverty line. The state's effectiveness in enrolling eligible residents in the program stands out as one of the key reasons why Illinois ranks higher than expected in terms of SNAP participation, with between 95% and 100% of eligible individuals engaged in the program.
5. California
- SNAP Participation Rate: 23.04%.
California, known for its affluent cities such as Santa Barbara and Malibu, faces stark economic disparities, evidenced by notable poverty rates in counties such as Fresno (26.9%) and Tulare (28.3%) in the central part of the state, the highest statewide. The low SNAP enrollment rate for eligible households in California raises concerns about the real magnitude of the food insecurity problem in the state.
6. Nevada
- SNAP Participation Rate: 23.43%.
According to a report by Feeding America reveals that Nevada experienced a dramatic jump from 20th to 5th on the list of states with the highest projections of food insecurity during the COVID-19 pandemic. This rise indicates the significant impact the health crisis has had on the state.
7. Louisiana
- SNAP Participation Rate: 24.20%
Louisiana has the highest poverty rate nationally at 19.6%. Given this reality, it is not surprising that the state's SNAP participation rate is very high, especially considering that nearly 27% of Louisiana's children live in poverty. SNAP participation increased markedly, exceeding 20%, between March 2022 and January 2023.
8. Massachusetts
- SNAP Participation Rate: 24.32%.
Despite being one of the most affluent states in the country, nearly 25% of Massachusetts residents rely on SNAP. During the pandemic, participation in the program increased significantly, registering a 21.4% increase.
9. Oregon
- SNAP Participation Rate: 25.68%.
Oregon faces unemployment and poverty rates above the national average, factors that contribute to its high SNAP participation rate. In addition, ongoing efforts over the past 15 years to increase awareness of the program's benefits have contributed to the growth in these numbers.
10. New Mexico
- SNAP Participation Rate: 31.25%
In New Mexico, participation numbers are boosted by policies that allow benefits for those with incomes up to 160% of the federal poverty level, compared to the 130% limit in most states. The ability to file applications online provides broader access to benefits. In addition, low state incomes, ranked in the bottom five nationally, also contribute to reliance on SNAP benefits among those facing economic hardship in the state.